What you see
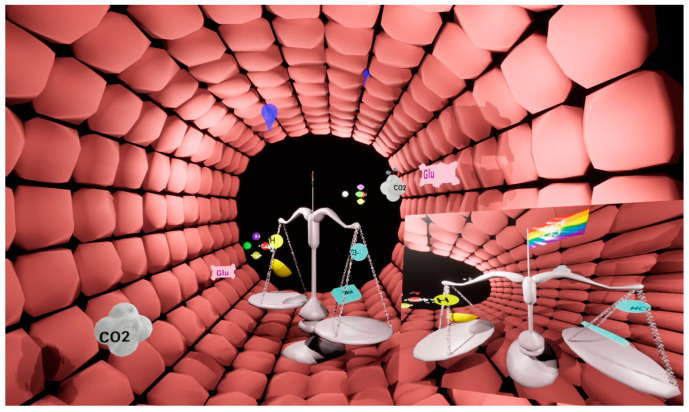
Blood gases, electrolytes, glucose and acid–base balance appear as visual elements inside a virtual blood vessel. The training video explains how these elements change when values move outside their normal ranges.
Blood gas analysis
Inside the blood vessel.
A visual language for blood gases.
Visual Blood represents blood gas information in a virtual blood vessel. Visual elements bring blood components and acid–base parameters into one scene, offering an alternative way to examine numerical results.
The research prototype
Explore blood gas results as an animated scene, then follow the studies behind the prototype.
Blood gases, electrolytes, glucose and acid–base balance appear as visual elements inside a virtual blood vessel. The training video explains how these elements change when values move outside their normal ranges.
The research includes screen-based and virtual-reality simulation studies, followed by a study of participants’ experiences. These studies examine interpretation and usability in simulated settings.
See it in action
Teaching videos, demonstrations and perspectives from the research.
Explanation of normal and abnormal blood gas visualizations, shared by the screen simulation, user-perception study, and narrative review.
The educational experience supplied with the virtual reality simulation study.
Publications from our group
4 publications and research documents coauthored by David W. Tscholl. Journal articles, protocols and preprints are identified individually.
Mixed methods analysis of participants from the two simulation studies; not a third independent efficacy cohort.
Original papers and supplementary files retain their source attribution. Earlier versions of the same work are grouped with the publication.
Explore Research