
- CT
- 67 s
- CFT
- 90 s
- α
- 70 °
- A10
- 48 mm
- MCF
- 60 mm
- ML
- 0 %
Visual ClotOnline-Simulator
See coagulation. Understand the curve.
Loading rendering …
What you see · Complete clot
Platelets, fibrin and factors present. No bleeding.
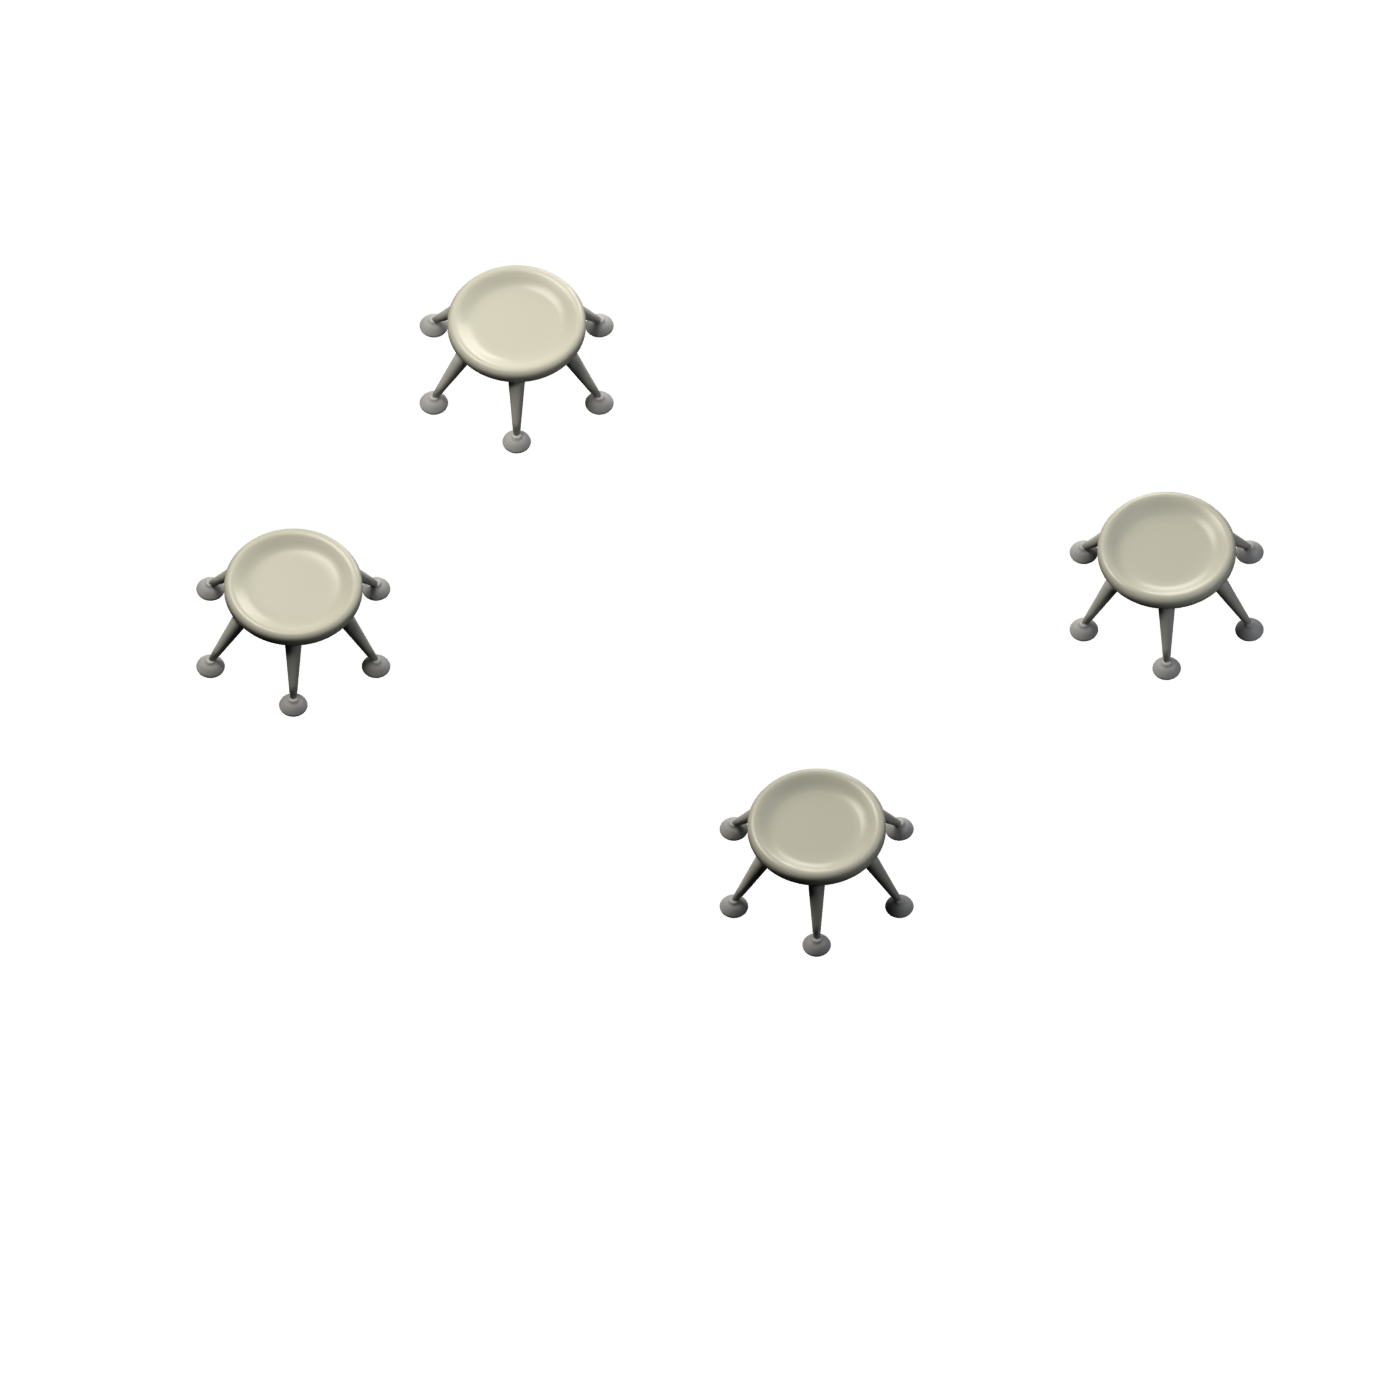
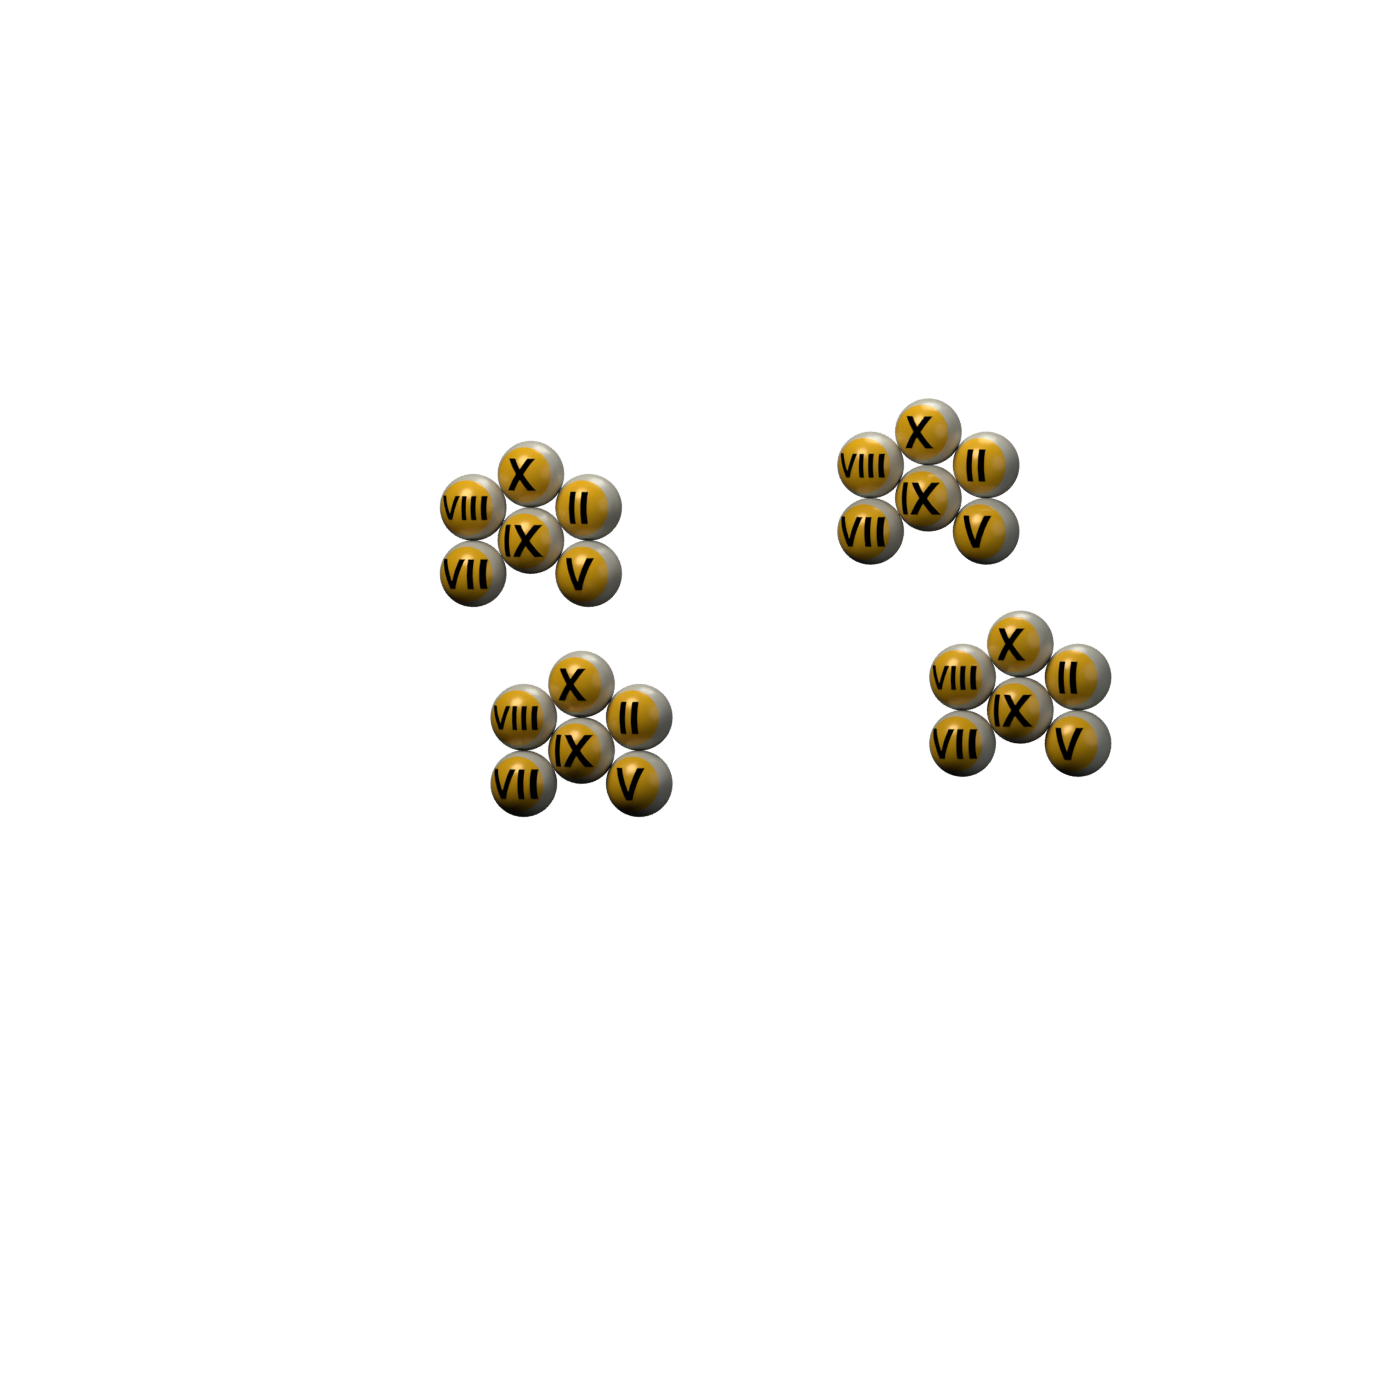
Details · visual symbols
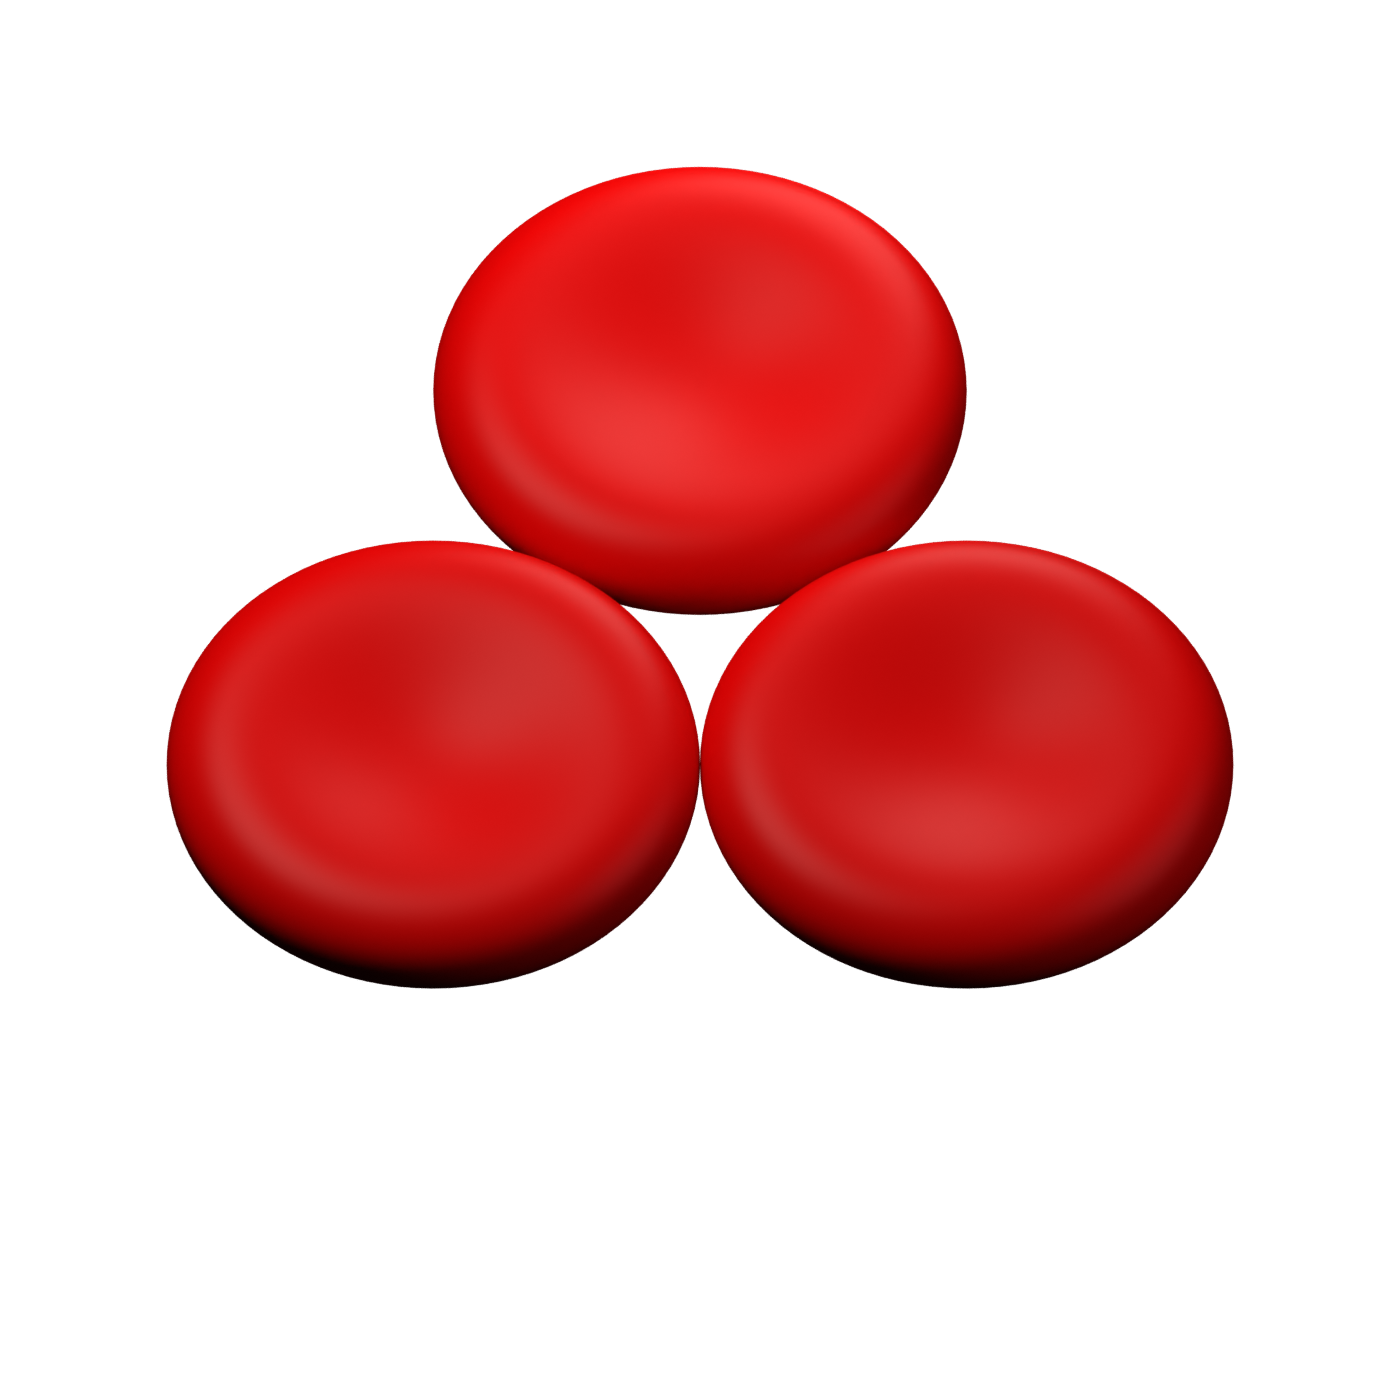
Original Visual Clot symbols. Red discs in the background are red blood cells. Missing components flash in the animation.
Comparison assay
- CT
- 180 s
- CFT
- 90 s
- α
- 70 °
- A10
- 48 mm
- MCF
- 60 mm
- ML
- 0 %
- CT
- 65 s
- CFT
- – s
- α
- – °
- A10
- 12 mm
- MCF
- 15 mm
- ML
- 0 %
- CT
- 70 s
- CFT
- 90 s
- α
- 70 °
- A10
- 48 mm
- MCF
- 60 mm
- ML
- 0 %
Curves reconstructed from source shapes · CT/CFT in seconds, clot firmness in mm.
Visual Clot from ROTEM values · default thresholdsVisual Clot develops with the measurement. Missing components during growth are provisional.
Published reference ranges · ROTEM
Reference intervals for the selected assay profile. These describe completed measurements, not the initial flat trace, and are distinct from treatment thresholds and Visual Clot mapping rules.
| Assay / cartridge | Published interval | Scope | Source |
|---|---|---|---|
| EXTEM | CT 38–79 s; CFT 34–159 s; MCF 50–72 mm | Adult reference intervals | Crochemore et al., 2018 |
| INTEM | CT 100–240 s; CFT 30–110 s; MCF 50–72 mm | Adult reference intervals | Crochemore et al., 2018 |
| FIBTEM | MCF 9–25 mm | Not the conditional platelet cutoffs | Visual Clot Table S1 |
Advanced settings · ROTEM Visual Clot thresholds
ROTEM: Mapping thresholds
Changes apply to this session and device. They change Visual Clot, not the simulated measurement values. The ROTEM source cases retain their original mapping.
Defaults: Table S1, Castellucci et al. (2022). All comparisons use strict < or > operators.
Default rules and their evidence · ROTEM
| Visual Clot rule | Default | Evidence / limitation |
|---|---|---|
| Fibrin deficiency: FIBTEM MCF < | 9 mm | Published Visual Clot algorithm · Table S1 |
| High FIBTEM MCF > | 25 mm | Published Visual Clot algorithm · Table S1 |
| Platelet deficiency with low FIBTEM: EXTEM/INTEM MCF < | 30 mm | Published Visual Clot algorithm · Table S1 |
| Platelet deficiency with intermediate FIBTEM: EXTEM/INTEM MCF < | 40 mm | Published Visual Clot algorithm · Table S1 |
| Platelet deficiency with high FIBTEM: EXTEM/INTEM MCF < | 50 mm | Published Visual Clot algorithm · Table S1 |
| Platelet deficiency with elevated lysis: APTEM MCF < | 30 mm | Published Visual Clot algorithm · Table S1 |
| Lysis: ML > and APTEM ML < | 15 % | Published Visual Clot algorithm · Table S1 |
| Factors: EXTEM CT > (without another disorder) | 79 s | Published Visual Clot algorithm · Table S1 |
| Factors: INTEM CT > (without another disorder) | 240 s | Published Visual Clot algorithm · Table S1 |
| Factors regardless of other disorders: EXTEM CT > | 100 s | Published Visual Clot algorithm · Table S1 |
| Factors regardless of other disorders: INTEM CT > | 260 s | Published Visual Clot algorithm · Table S1 |
| Heparin: INTEM CT > | 240 s | Published Visual Clot algorithm · Table S1 |
| and HEPTEM CT < | 240 s | Published Visual Clot algorithm · Table S1 |
| Hypercoagulability: EXTEM/INTEM MCF > | 72 mm | Published Visual Clot algorithm · Table S1 |
The controls below show the currently applied or edited values. Default values above remain the documented baseline.
Source material, references and model limitations · ROTEM
Hypercoagulability: Rössler et al., Anaesthesia 2020 includes hypercoagulable scenarios. The ROTEM rule (EXTEM or INTEM MCF > 72 mm) is documented in the published Visual Clot algorithm. This preset uses illustrative high-firmness curves, not the unavailable original supplemental trace. For TEG, CRT MA > 70 mm, and for Quantra, QStat CS > 35.4 hPa, are teaching mappings from upper reference limits, not validated hypercoagulability diagnostic criteria. Reduced stretching is a new teaching visual. Hypercoagulability alone does not produce a bleeding effect once clot development is complete.
Scenario controls generate fixed teaching values specific to each device. These are not patient measurements or conversions between ROTEM and TEG. Thresholds then determine the Visual Clot display. Switching devices retains the scenario and the respective thresholds, and returns playback to the completed result.
Quantra: separate simulated QPlus and QStat cartridges. Factors and heparin use QPlus CT/CTH/CTR; fibrin and platelets use QStat FCS/PCS; lysis uses QStat CSL. Parameter availability and the 60-minute stiffness curves are illustrative, not proprietary SEER processing or patient recordings. Final stiffness is released at 12.5 minutes and CSL at 30 minutes in this teaching model. Reference intervals are not validated treatment triggers or an established Quantra-to-Visual-Clot algorithm.
ROTEM: Castellucci et al., Diagnostics 2022, Table S1. Open all ten source cases with original images. APTEM and HEPTEM are both calculated and included in the mapping. The fourth visible assay can be switched. The strong CT rule may also indicate factor deficiency when heparin is present.
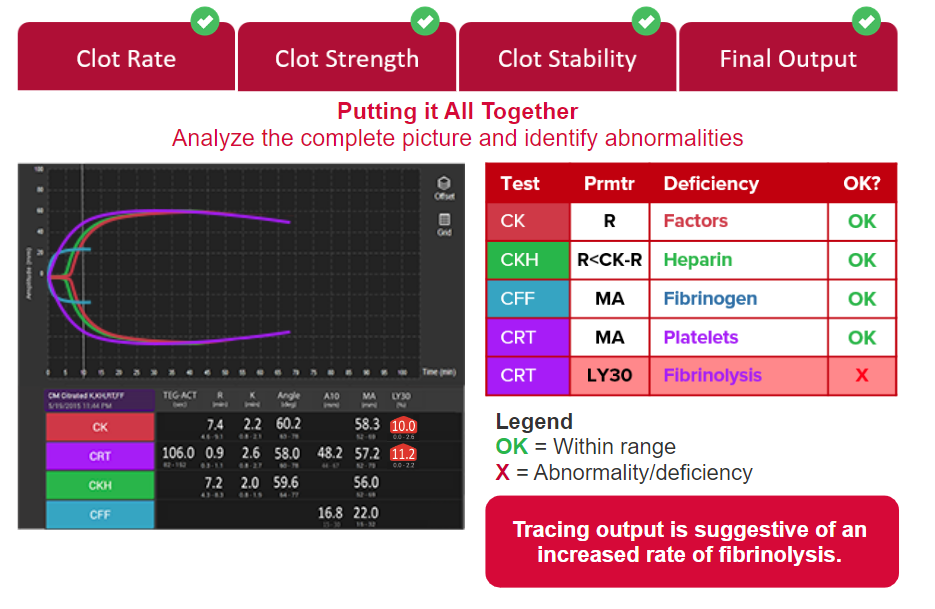
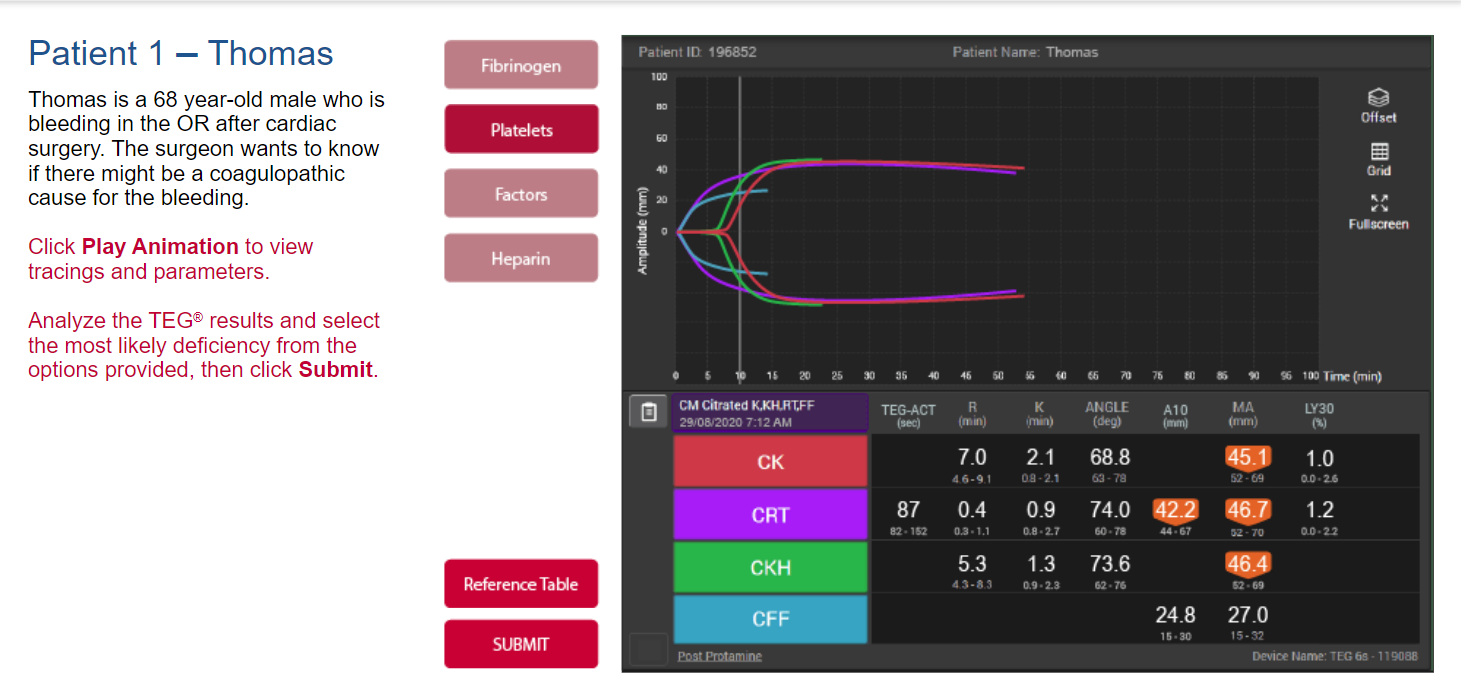
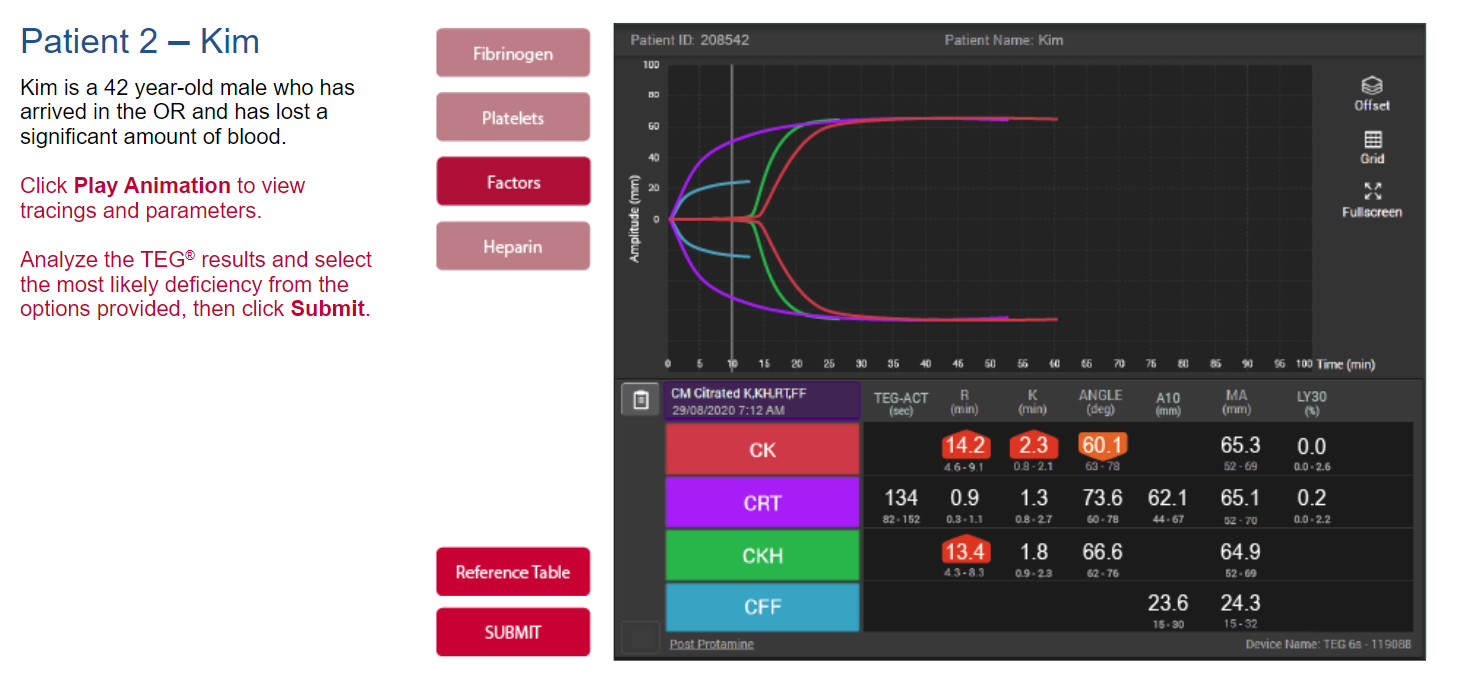
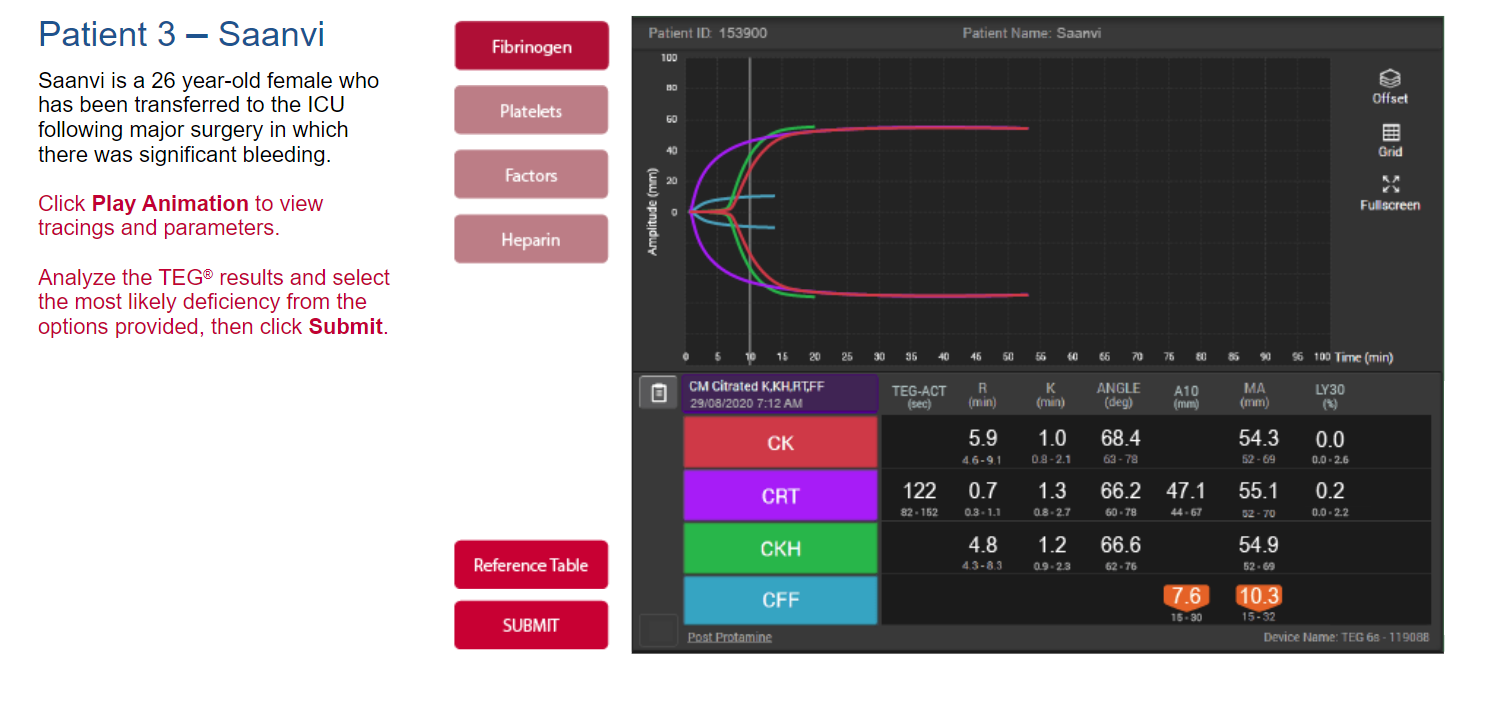
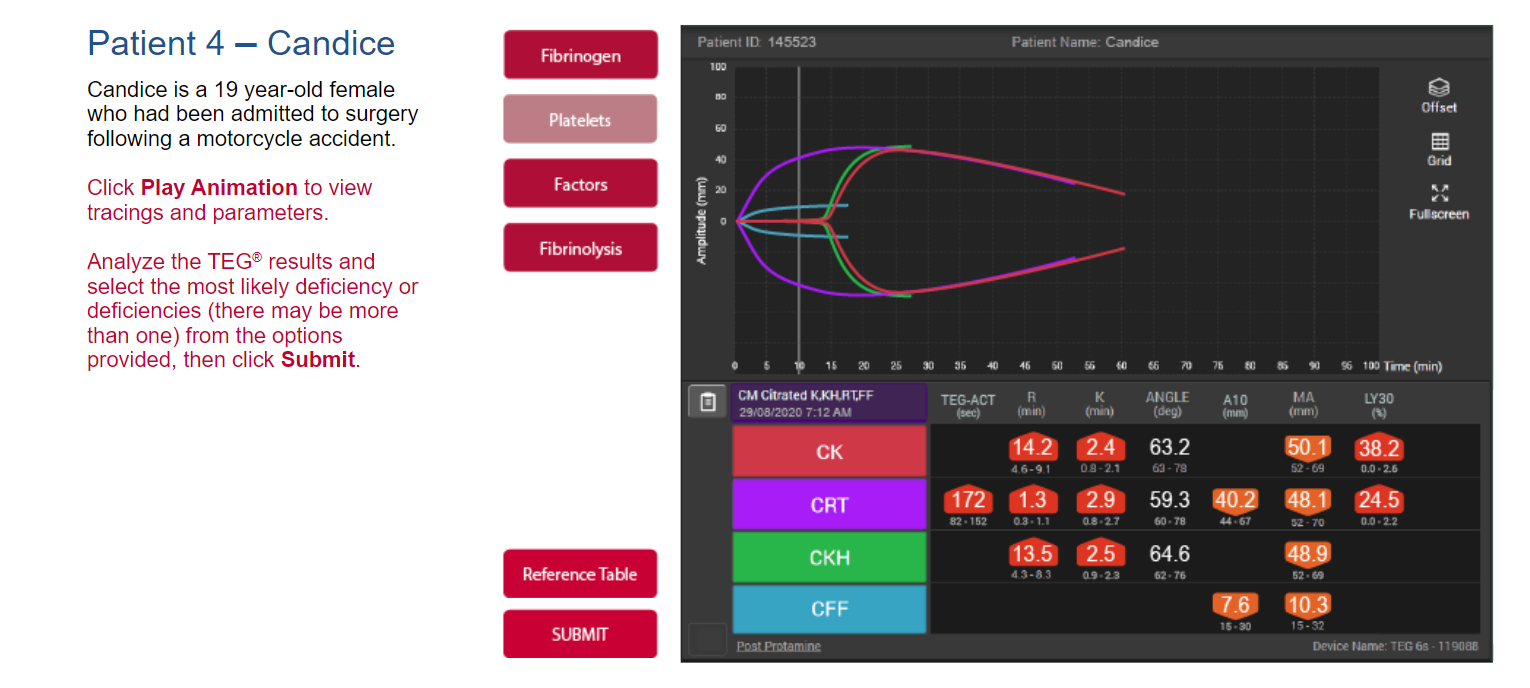
TEG 6s: Display based on VC@Hemosonics.pptx, CM cartridge CK/CRT/CKH/CFF. Haemonetics CM cartridge reference and TEG 6s user manual. CK-R, or CKH-R when heparin is detected, maps to factors; CFF-MA to fibrin; CRT-MA to platelets; and CRT-LY30 to lysis. A CK/CKH ratio of 1.5 and a CRT-MA cutoff of 40 mm when CFF is low are unvalidated teaching assumptions for combined scenarios.
During playback, growing clot amplitudes are compared with the mapping cutoffs. Components start absent; CT/R and heparin require observed timing evidence. ROTEM lysis uses observed amplitude loss and APTEM; TEG LY30 is used only at MA + 30 minutes. Early absence means pending clot development, not a confirmed deficiency. This temporal extension is an illustrative teaching rule. Curve shapes are traced from the supplied PowerPoint images and adapted to the teaching values. TEG uses the CK/CRT/CKH/CFF colour envelopes; ROTEM uses the original filled silhouettes. These reconstructions retain measurement landmarks but are not original patient traces. All curves run to 60 minutes; after the modelled lysis interval the residual amplitude is held. LY30 remains pending if MA + 30 minutes falls after the measurement window. The TEG lysis envelope is adapted to MA + 30 minutes and does not reproduce the device’s area-based LY30 calculation. Angle is a reference value; TEG-ACT, A10 and FLEV are not calculated. CKH and CFF do not report LY30. Curves and binary mappings are not clinically validated.
Original TEG images from the presentation